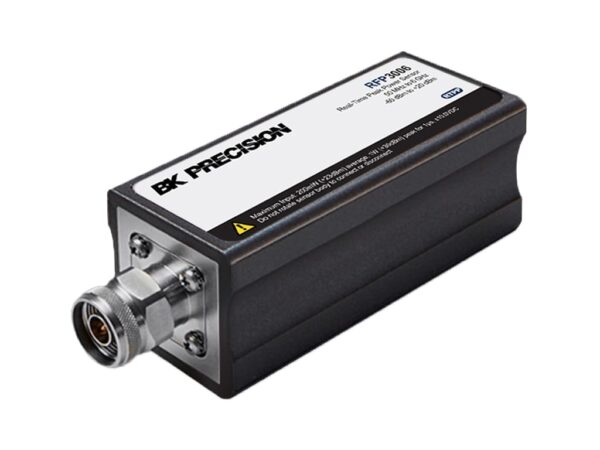
B&K Precision RFP3008 – RF Peak Power Sensor (RF Range: 50 MHz – 8 GHz)
$9,060.00
8 GHz RF Power Sensor, Real-Time
Description
BK Precision RFP3008 – RF Peak Power Sensor (RF Range: 50 MHz – 8 GHz)
RF peak power sensor
RF frequency range: 50 MHz to 8 GHz
Video Bandwidth (high/std): 165 MHz / 350 kHz
Real time power processing
Powered by host USB connection, no need for external power supply
The RFP3000 Series RF Peak Power Sensors are the performance leaders in the peak power measurement segment. Each sensor utilizes real-time processing and enhanced hardware triggering to capture even the most elusive signals. The RFP3000 Series specifications are impressive, offering best in class video bandwidth, rise times and time resolution.
The sensors, in combination with the included Power Analyzer software measure pulsed, bursted, and modulated signals used in commercial and military radar, electronic warfare (EW), wireless communications (e.g., LTE, LTE-A, and 5G), consumer electronics (WLAN and WiFi 6), as well as education and research applications.
The RFP3000 Series is powered by the host computer’s USB port. The Power Analyzer software takes full advantage of the sensor’s capabilities to perform peak power measurements in real-time and can be installed on additional workstations as needed.
Several versions available
BK Precision offers several versions of its RFP3000 power sensor. The following is an overview of the main features for each:
Sensor RFP3006 RFP3008 RFP3018 RFP3118 RFP3040 RFP3140
RF Frequency Range 50 MHz to 6 GHz 50 MHz to 8 GHz 50 MHz to 18 GHz 50 MHz to 18 GHz 50 MHz to 40 GHz 50 MHz to 40 GHz
Video Bandwidth (high/std) 195 MHz / 350 kHz 165 MHz / 350 kHz 70 MHz / 350 kHz 6 MHz / 350 kHz 70 MHz / 350 kHz 6 MHz / 350 kHz
Dynamic Range
Average -60 to +20 dBm -60 to +20 dBm (1)
-53 to +20 dBm (2) -34 to +20 dBm -50 to +20 dBm -34 to +20 dBm -50 to +20 dBm
Pulse -50 to +20 dBm -50 to +20 dBm (1)
-43 to +20 dBm (2) -24 to +20 dBm -40 to +20 dBm -24 to +20 dBm -40 to +20 dBm
(1) From 50 MHz to 6 GHz, (2) From >6 GHz to 8 GHz
Advanced measurement and analysis software
B&K Precision’s Power Analyzer software supports sensor configuration, signal capturing and analysis. Install Power Analyzer on as many workstations as you need at no cost.
Features include:
Trace and meter display types
Statistical measurement mode, including CCDF
Markers and automatic measurements
Multi-pulse analysis
Supports up to 8 simultaneous power measurement channels
Skew adjustment between channels
Save and recall measurement settings
Screen capture and flexible data export in csv and pdf format
USB driver, remote control API, firmware updater, virtual panel
Auto Marker Measurements
A. View up to 16 unique Automatic Marker Measurements on-screen.
Power Analyzer software
B. “Between Marker” measurements are ideal for monitoring parameters such as pulse power or crest factor over long intervals.
C. To simplify testing, the RFP3000 Series can automatically measure and calculate 16 common power and timing parameters and display the parameters of interest. Other parameters include: rise time, fall time, pulse average, overshoot, and droop.
D. Advanced Multi-channel Pulse Analysis
Real time power processing
Real-Time Power Processing dramatically reduces the total cycle time for acquiring and processing power measurement samples. By combining a dedicated acquisition engine, hardware trigger, integrated sample buffer, and a real-time optimized parallel processing architecture, Real-Time Power Processing performs most of the sweep processing steps simultaneously, beginning immediately after the trigger instead of waiting for the end of the acquisition cycle.
The advantages of the Real-Time Power Processing technique are shown in Figure 1a. Key processing steps take place in parallel and keep pace with the signal acquisition. With no added computational overhead to prolong the sweep cycle, the sample buffer cannot overflow. As a result, there is no need to halt acquisition for trace processing. This means gap-free signal acquisition virtually guarantees that intermittent signal phenomena such as transients, dropouts, or interference will be reliably captured and analyzed, shown in Figure 1b. These sorts of events are most often missed by conventional power meters due to the acquisition gaps while processing takes place.
Comparison between conventional power measurement sample processing and Real-Time Power Processing.
Identification of a signal dropout with Real-Time Power Processing.
Superior time resolution
The RFP3000 Series features 100 ps time base resolution and with an acquisition rate up to 100 MSPS, can provide 50 points per division with a time base range as low as 5 ns / division. This enables users to see meaningful waveform information (Figure 2a) missed by alternative power analyzers (Figure 2b). In addition, the instrument’s superior time management enables several other advantages. Pulse widths as narrow as 10 ns can be captured and characterized with outstanding trigger stability (< 100 ps jitter, rms). RFP3000 Series waveform analysis with 10 ns/div time base and 50 samples per division. “Conventional” power meter waveform analysis with 10 ns/div time base and 1 sample per division. Video bandwidth Video bandwidth (VBW) describes the ability of a power sensor to track peak (envelope) power. Insufficient VBW will result in errant envelope and average power measurements. The RFM3000 Series offers the widest video bandwidth (195 MHz) making it ideal for measuring 80 MHz, 100 MHz, and 160 MHz channels. Measurement buffer mode The RFP3000 Series Measurement Buffer mode is a remote control function that works in conjunction with Real-Time Power Processing to provide only the relevant burst or pulse information, eliminating the need to download and post-process large sample buffers. As a result, users can collect and analyze measurements from a virtually unlimited number of consecutive pulses or events. A wide variety of parameters can be calculated and plotted, such as duty cycle, pulse repetition rate, pulse width variation, and pulse jitter. In addition, anomalies, such as dropouts, can be identified. Example seven pulse waveform. Measurement buffer data returned for waveform in above. Powerful statistical analysis Crest factor, or peak-to-average power ratio, is an important measurement for characterizing device-under-test (DUT) performance, such as amplifier linearity. With the Power Analyzer software package, users can utilize the complementary cumulative distribution function (CCDF) to assess the probability of various crest factor values to gain further insight into DUT performance. The CCDF and other statistical values are determined from a very large population of power samples captured at a 100 MSPS acquisition rate on all channels simultaneously. Comparing CCDF plots of a signal at an amplifier input (yellow) and output (blue). Compatible with RFM3000 RFM power meters for benchtop operation (sold separately) The RFM3000 Series is suited for stand-alone operation in a familiar benchtop form factor supporting up to 4 sensors. B&K Precision's Power Analyzer software is built-in with LAN and optional GPIB connectivity. The RFM3000 can be found in the accessories section of this page.


Reviews
There are no reviews yet.